ML-LAB-VI-SEM
Exercise 04
Implementation of Multiple Linear Regression for House Price Prediction using sklearn
Aim
To implement Multiple Linear Regression using Python and sklearn to predict house prices based on multiple features.
Procedure/Program
import numpy as np
import pandas as pd
import matplotlib.pyplot as plt
from sklearn.model_selection import train_test_split
from sklearn.linear_model import LinearRegression
from sklearn.metrics import mean_squared_error, r2_score
# sample dataset (House Features: Size in sq ft, Bedrooms, Age)
data = {
"Size": [1500, 1800, 2400, 3000, 3500, 4000, 4200, 5000, 5500, 6000],
"Bedrooms": [3, 3, 4, 3, 5, 4, 5, 6, 5, 7],
"Age": [10, 15, 20, 18, 30, 8, 12, 5, 7, 2],
"Price": [300000, 350000, 400000, 450000, 500000, 600000, 620000, 750000, 800000, 900000]
}
# DataFrame
df = pd.DataFrame(data)
# splitting independent (X) and dependent (y) variables
X = df[["Size", "Bedrooms", "Age"]]
y = df["Price"]
# training and testing sets
X_train, X_test, y_train, y_test = train_test_split(X, y, test_size=0.2, random_state=42)
# creating and training the model
model = LinearRegression()
model.fit(X_train, y_train)
# predicting house prices
y_pred = model.predict(X_test)
# model evaluation
mse = mean_squared_error(y_test, y_pred)
r2 = r2_score(y_test, y_pred)
# results
print("Model Coefficients:", model.coef_)
print("Model Intercept:", model.intercept_)
print("Mean Squared Error:", mse)
print("R-squared Score:", r2)
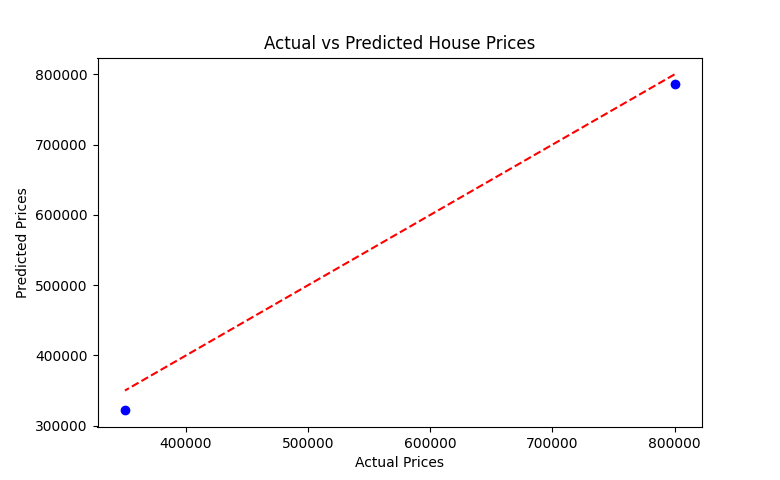
# plotting actual vs predicted prices
plt.scatter(y_test, y_pred, color='blue')
plt.plot(y_test, y_test, color='red', linestyle="dashed") # perfect fit line
plt.xlabel("Actual Prices")
plt.ylabel("Predicted Prices")
plt.title("Actual vs Predicted House Prices")
plt.show()
Output/Explanation
-
Output:
Model Coefficients: [  109.80609436 18135.41266371 -2774.2807285 ]
Model Intercept: 111253.60186975863
Mean Squared Error: 492420858.93240654
R-squared Score: 0.9902731682186191
The program trains a Multiple Linear Regression model and predicts house prices based on Size, Bedrooms, and Age. Expected output includes:
- Model coefficients (impact of each feature on price)
- Model intercept
- Evaluation metrics: Mean Squared Error (MSE) and R-squared score (R²)
- A scatter plot comparing actual and predicted house prices.
-
Explanation:
- The dataset consists of three independent variables: Size, Bedrooms, and Age, with Price as the dependent variable.
- The dataset is split into training and testing sets.
- A Multiple Linear Regression model is trained using
LinearRegression(). - The model predicts house prices for the test set and evaluates performance using MSE and R² score.
- A scatter plot is generated to visualize the difference between actual and predicted prices.