OOAD-LAB-VI-SEM
Exercise 07
Drawing State Chart Diagram for Point of Sale (POS) System
Aim
To draw the State Chart Diagram for a Point of Sale (POS) System.
Theory
A State Chart Diagram (also known as a State Machine Diagram) in UML represents the states an object can be in, along with the events that cause a transition between states. It is used to model the dynamic behavior of a system.
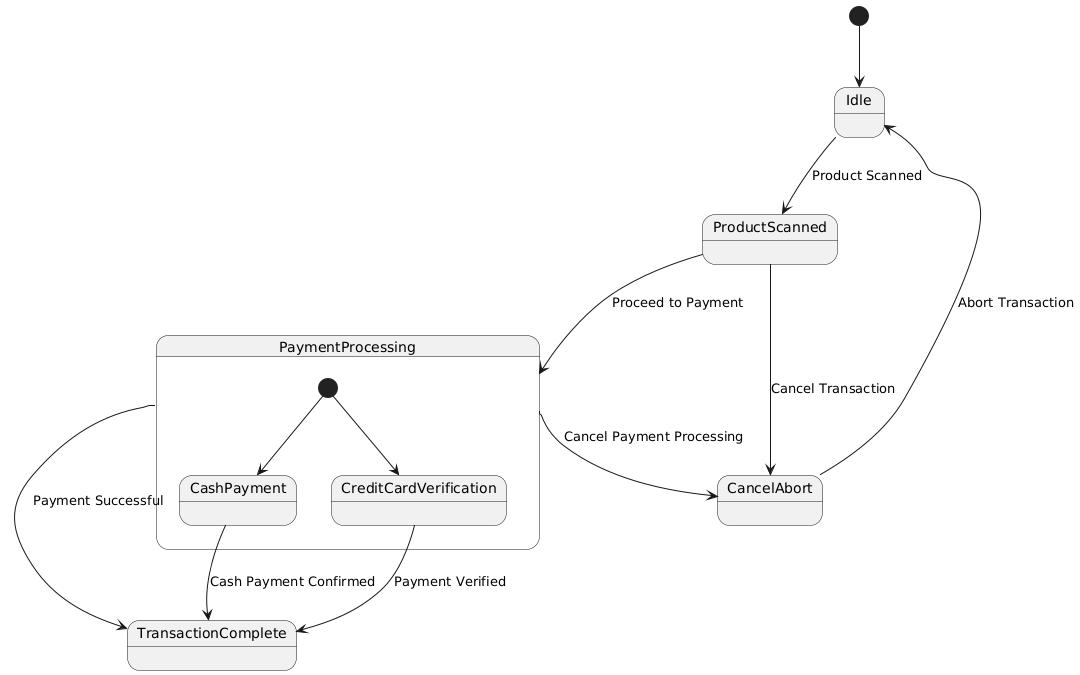
For a Point of Sale (POS) System, the diagram represents the different states a transaction can go through, from the moment the POS system is powered on until the transaction is completed. This includes states like “Idle”, “Product Scanned”, “Payment Processing”, and “Transaction Complete”.
Procedure/Program
- Identify States:
- Idle: The initial state of the POS system, waiting for an action from the user (e.g., a product scan).
- Product Scanned: A product has been scanned, and the system is ready to proceed to payment.
- Payment Processing: The system is processing the payment (could include sub-states like “Credit Card Verification”, “Cash Payment”).
- Transaction Complete: The transaction is successfully completed, and the customer has been charged.
- Cancel/Abort: If a user cancels the transaction, the system moves to the cancel state and clears all entered data.
- Define Transitions:
- From Idle to Product Scanned: Triggered when a product is scanned.
- From Product Scanned to Payment Processing: Triggered when the user chooses to proceed to payment.
- From Payment Processing to Transaction Complete: Triggered when the payment is successful.
- From Product Scanned to Cancel/Abort: Triggered if the user cancels the transaction before payment.
- From Payment Processing to Cancel/Abort: Triggered if the user cancels payment processing.
- From Cancel/Abort to Idle: After a transaction is canceled, the system returns to idle state.
- Draw the State Chart Diagram:
- Represent each state as a rounded rectangle.
- Use arrows to represent transitions between states.
- Label each transition with the event that triggers it.
- Indicate any conditions that might affect transitions, such as successful payment or cancellation.
Output/Explanation
- State Chart Diagram:
- The output will be a state chart diagram showing the different states of the POS system and the transitions between them.
Example of states and transitions:
- Idle (Initial State) → Product Scanned → Payment Processing → Transaction Complete.
- Idle → Cancel/Abort → Idle.
- Product Scanned → Cancel/Abort → Idle.
Explanation:
-
The State Chart Diagram models the dynamic behavior of the POS system, focusing on how the system responds to various events (such as scanning a product, processing payment, or canceling the transaction) and transitions through different states.
-
By using this diagram, the system’s workflow is clearly represented, helping to understand how the system reacts to user actions during a transaction.